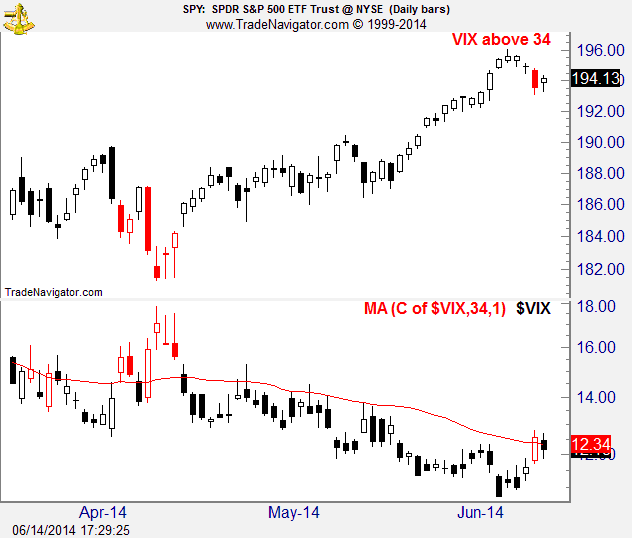
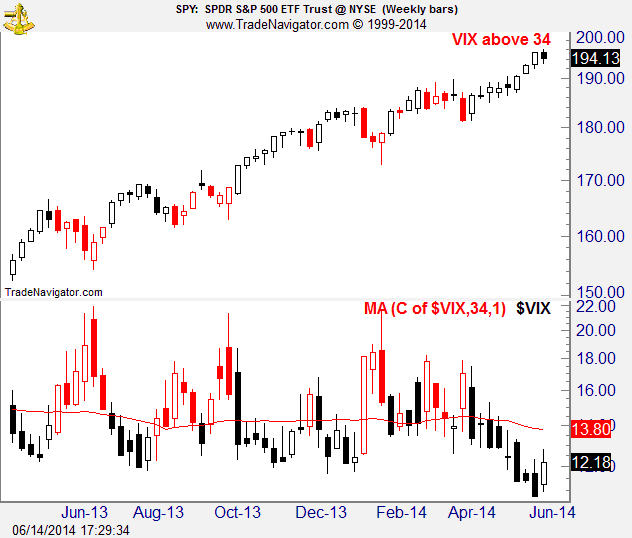
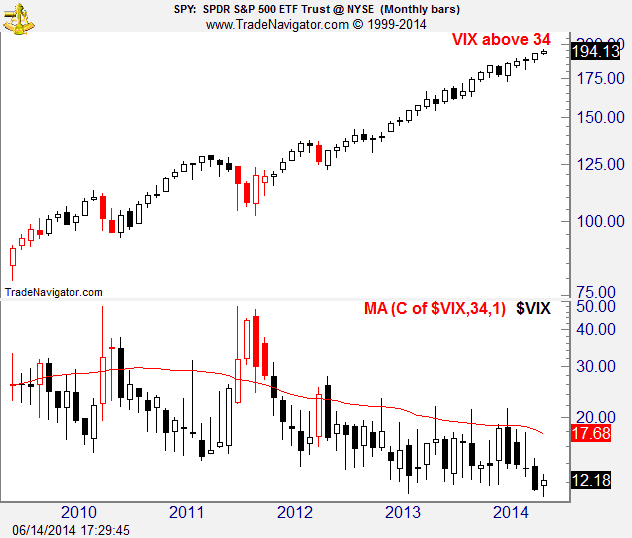
VIX Above 34
Chart in Focus from McClellan Financial Publications is a wonderful source of technical analysis ideas. The 23 July 2010 edition inspired me to work with the VIX and a long-term moving average to create something to anticipate tops. I settled on working with a 34-period simple moving average applied to the VIX after a small amount of experimentation. Within my Trade Navigator software, I created a custom function and use it to highlight price bars when the VIX is above 34.
The VIX Above 34 study does a pretty good job of “lighting up” the area near tops and highlighting areas of market weakness. It is late calling some tops, but always warns before falling prices do serious damage. The study is good at warning of danger to profitable long positions and to alerting traders to the potential of making productive use of short positions.
On the other hand, the study does NOT recover from calling attention to bearish market segments quickly. The delay is sometimes a simple matter of the VIX taking time to settle below its moving average after a spike upwards, but there are occasions where VIX maintains a high level for long periods even when the market is rising. Therefore, the study can be late sounding the all-clear signal.
As I have written this description, I have gotten a few ideas about how to improve the application of the VIX and a moving average to market signalling, but that must wait for another day.


 Financial markets are predictable because segments of price action fit together in a limited number of patterns that are not random. Markets are unpredictable too because there is enough variability in the patterns to hide the trend at some stages of development. I am fascinated by the market and spend a lot of time working to identify price trends so I can exploit them for profit.