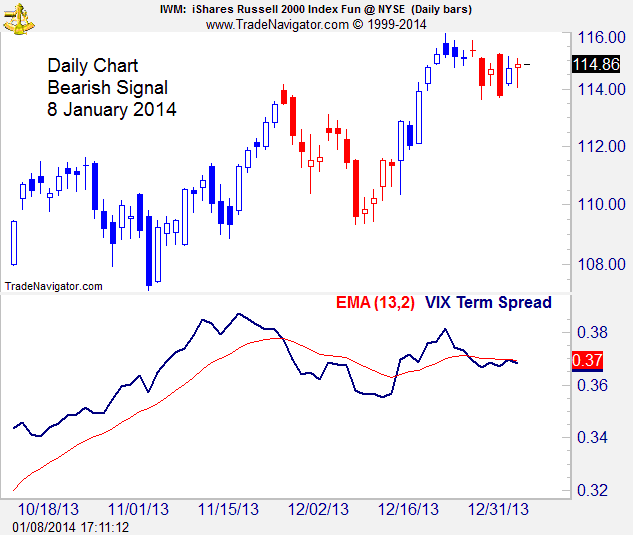
Bearish signals flashing on 13 January 2014
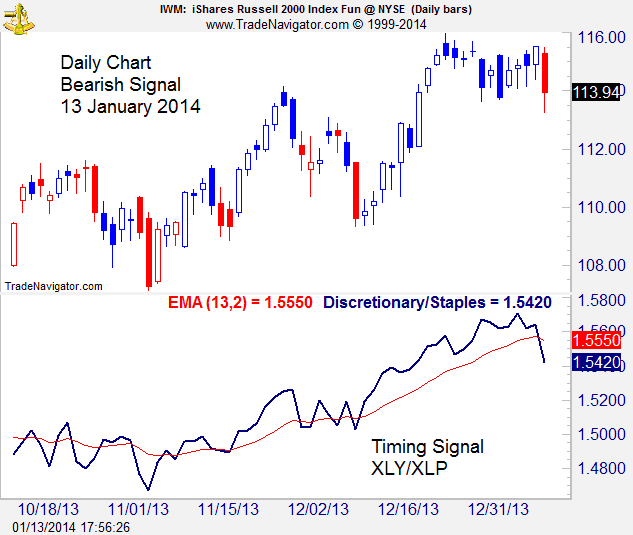
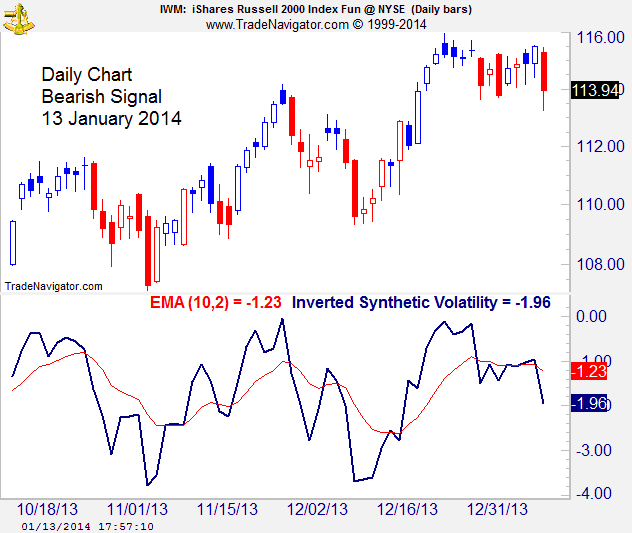
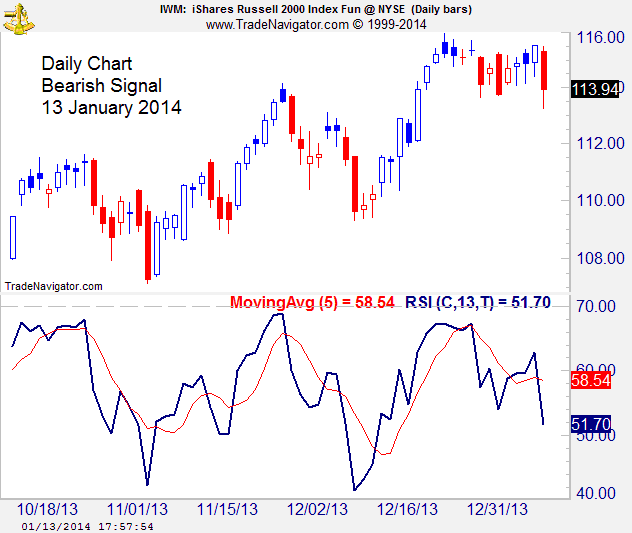
The discretionary/staples spread, synthetic volatility, and RSI studies produced bearish signals on the daily charts on Monday, 13 January. The volatility spread, that originally turned bearish on 31 December, remains bullish since 9 January. I have been using the high of 31 December at 115.71 as my excuse for staying bearish through recent swings.
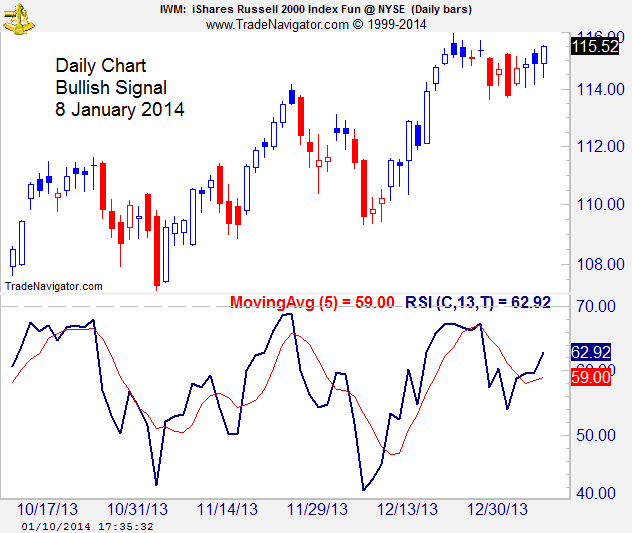
Bullish daily signals are back
The market was up and down on Friday, but bullish signals dominated the daily charts of the Russell 2000 by the end of the day. I have not taken action yet, but it looks as if I will need to do so on Monday. I have been allowing to 115.71, the peak of the first bearish signal in the series.
I started looking at a faster RSI Trend study today that works pretty well on daily charts, but not on the weeklies.
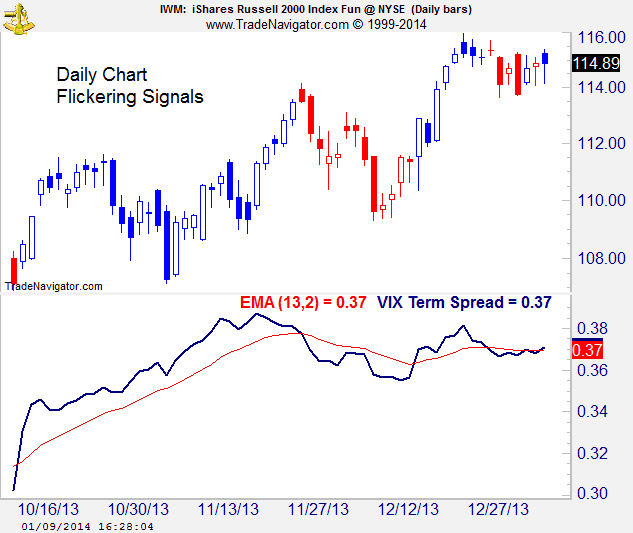
Flickering signals
Signals from the volatility spread have been flickering on the daily chart – bearish, bullish, bearish, bullish. To filter, I am staying bearish against the peak of the original bearish signal of 31 December 2013 at 115.71.
Volatility spread guidance is itself volatile lately
Stocks have been marching in place, making trend guidance volatile. I have been letting things ride against 115.71, the high of the bearish signal of 31 December 2013.
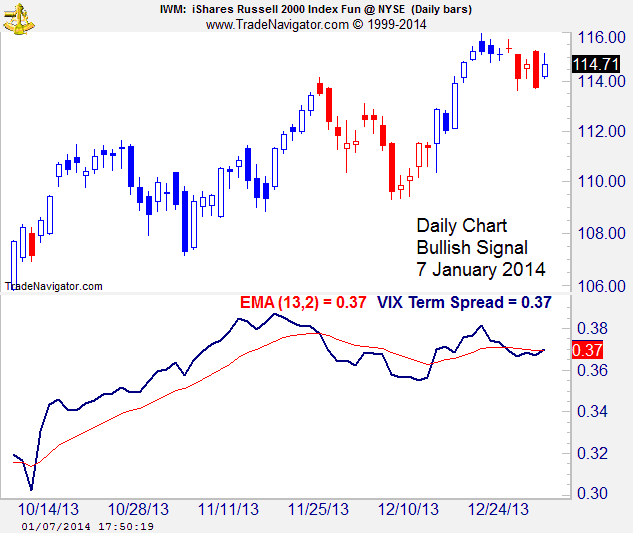
Volatility Spread Guidance Wavering
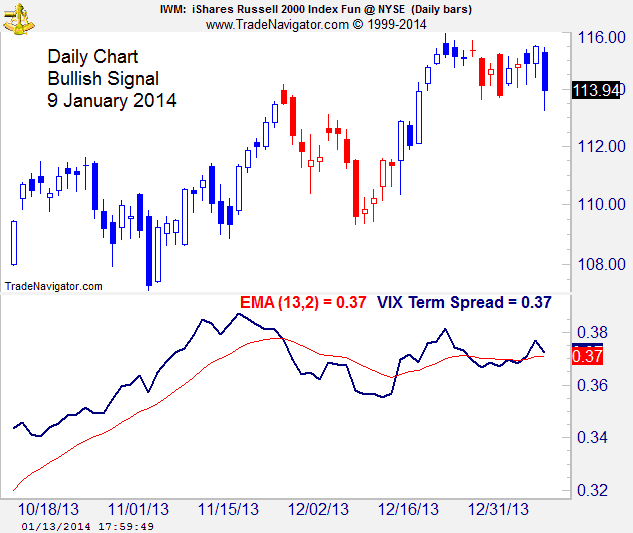
The volatility spread and its moving average both closed at 0.37 today. The system paints such a develop as a cross-over, so the daily chart shifted to a bullish signal. I am waiting to see what develops on Wednesday before concluding that prices may push meaningfully higher.

 Financial markets are predictable because segments of price action fit together in a limited number of patterns that are not random. Markets are unpredictable too because there is enough variability in the patterns to hide the trend at some stages of development. I am fascinated by the market and spend a lot of time working to identify price trends so I can exploit them for profit.