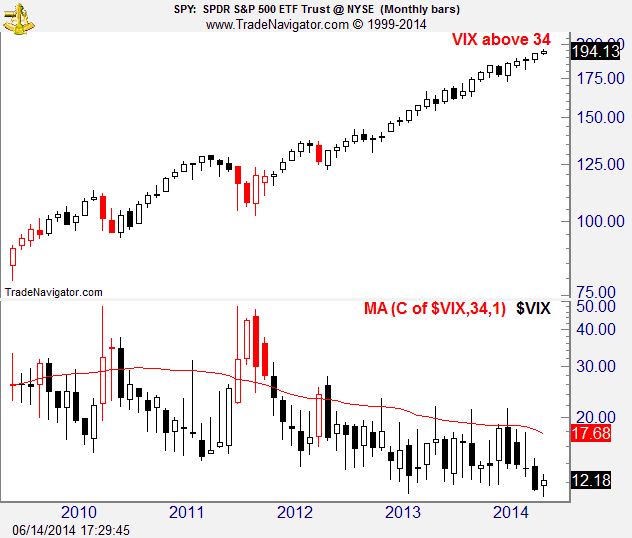
VIX Above 34
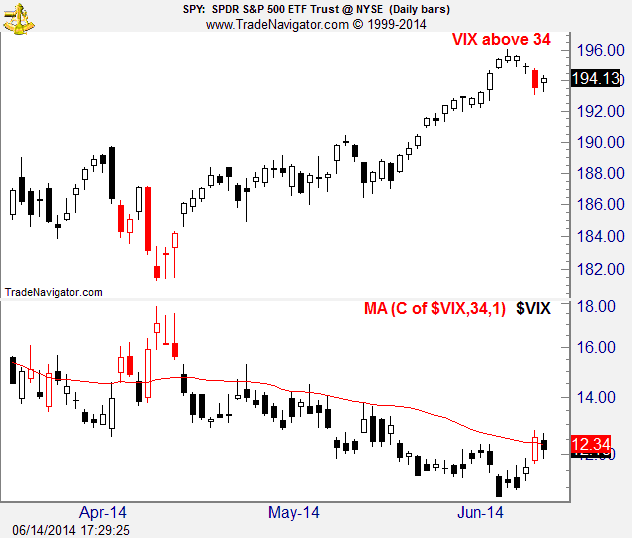
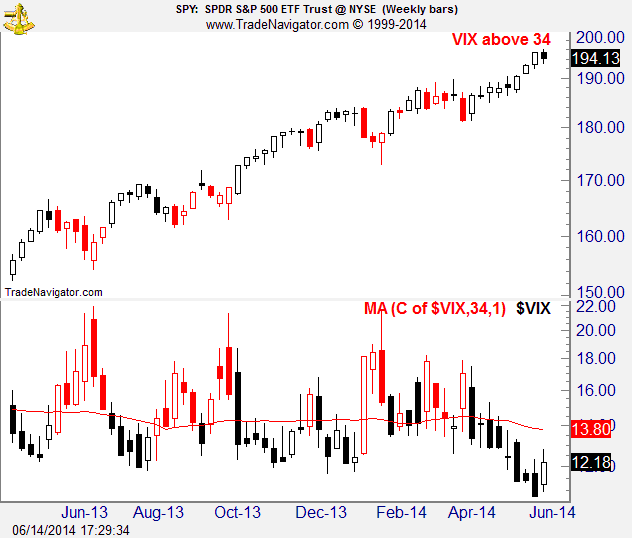
Chart in Focus from McClellan Financial Publications is a wonderful source of technical analysis ideas. The 23 July 2010 edition inspired me to work with the VIX and a long-term moving average to create something to anticipate tops. I settled on working with a 34-period simple moving average applied to the VIX after a small amount of experimentation. Within my Trade Navigator software, I created a custom function and use it to highlight price bars when the VIX is above 34.
The VIX Above 34 study does a pretty good job of “lighting up” the area near tops and highlighting areas of market weakness. It is late calling some tops, but always warns before falling prices do serious damage. The study is good at warning of danger to profitable long positions and to alerting traders to the potential of making productive use of short positions.
On the other hand, the study does NOT recover from calling attention to bearish market segments quickly. The delay is sometimes a simple matter of the VIX taking time to settle below its moving average after a spike upwards, but there are occasions where VIX maintains a high level for long periods even when the market is rising. Therefore, the study can be late sounding the all-clear signal.
As I have written this description, I have gotten a few ideas about how to improve the application of the VIX and a moving average to market signalling, but that must wait for another day.
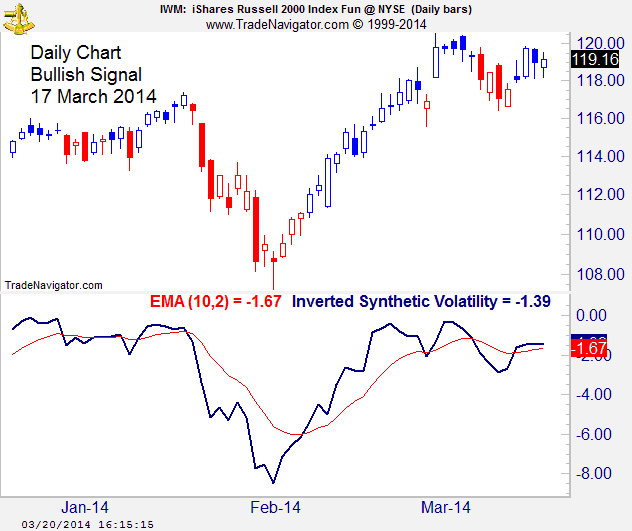
March 20, 2014
Synthetic volatility turned bullish on 17 March. The actual volatility study turned bullish on 18 March and then shifted back to the bearish side on 19 March. The various signals I watch are currently almost evenly split between bullish and bearish, suggesting this is a good market in which to do nothing.
Prime Rate Indicator Buy and Sell Signals
Martin Zweig proposed the following rules for stock market buy and sell signals based upon the level and direction of interest rates in Winning on Wall Street.
Buy Signal: Any initial cut in the Prime Rate if the peak was less than 8 percent. Or, if the peak is 8 percent or greater, a buy signal comes on either the second of two cuts or a full 1 percent cut in the rate.
Sell Signal: Any initial hike in the Prime Rate if the low was 8 percent or greater. Or, if the low is less than 8 percent, a sell signal comes on either the second of two hikes or on a full 1 percent increase in the rate.
The table below documents the levels of the Prime Rate and the dates when the Prime Rate Indicator developed Buy or Sell Signals since 1947. Click here to read how The Prime Rate Indicator may have passed its prime.
| Signal | Date of Change | Prime Rate (%) |
| 12/16/2008 | 3.25 | |
| 10/29/2008 | 4 | |
| 10/8/2008 | 4.5 | |
| 4/30/2008 | 5 | |
| 3/18/2008 | 5.25 | |
| 1/30/2008 | 6 | |
| 1/22/2008 | 6.5 | |
| 12/11/2007 | 7.25 | |
| 10/31/2007 | 7.5 | |
| Buy | 9/18/2007 | 7.75 |
| 6/29/2006 | 8.25 | |
| 5/10/2006 | 8 | |
| 3/28/2006 | 7.75 | |
| 1/31/2006 | 7.5 | |
| 12/13/2005 | 7.25 | |
| 11/1/2005 | 7 | |
| 9/21/2005 | 6.75 | |
| 8/9/2005 | 6.5 | |
| 6/30/2005 | 6.25 | |
| 5/3/2005 | 6 | |
| 3/22/2005 | 5.75 | |
| 2/2/2005 | 5.5 | |
| 12/14/2004 | 5.25 | |
| 11/10/2004 | 5 | |
| 9/22/2004 | 4.75 | |
| Sell | 8/11/2004 | 4.5 |
| 7/1/2004 | 4.25 | |
| 6/27/2003 | 4 | |
| 11/7/2002 | 4.25 | |
| 12/12/2001 | 4.75 | |
| 11/7/2001 | 5 | |
| 10/3/2001 | 5.5 | |
| 9/18/2001 | 6 | |
| 8/22/2001 | 6.5 | |
| 6/28/2001 | 6.75 | |
| 5/16/2001 | 7 | |
| 4/19/2001 | 7.5 | |
| 3/21/2001 | 8 | |
| Buy | 2/1/2001 | 8.5 |
| 1/4/2001 | 9 | |
| 5/17/2000 | 9.5 | |
| 3/22/2000 | 9 | |
| 2/3/2000 | 8.75 | |
| 11/17/1999 | 8.5 | |
| Sell | 8/25/1999 | 8.25 |
| 7/1/1999 | 8 | |
| 11/18/1998 | 7.75 | |
| Buy | 10/16/1998 | 8 |
| 9/30/1998 | 8.25 | |
| Sell | 3/27/1997 | 8.5 |
| 1/31/1996 | 8.25 | |
| Buy | 12/20/1995 | 8.5 |
| 7/7/1995 | 8.75 | |
| 2/1/1995 | 9 | |
| 11/15/1994 | 8.5 | |
| 8/16/1994 | 7.75 | |
| 5/18/1994 | 7.25 | |
| Sell | 4/19/1994 | 6.75 |
| 3/24/1994 | 6.25 | |
| 7/2/1992 | 6 | |
| 12/23/1991 | 6.5 | |
| 11/6/1991 | 7.5 | |
| 9/13/1991 | 8 | |
| 5/1/1991 | 8.5 | |
| 2/4/1991 | 9 | |
| 1/2/1991 | 9.5 | |
| 1/8/1990 | 10 | |
| Buy | 7/31/1989 | 10.5 |
| 6/5/1989 | 11 | |
| 2/24/1989 | 11.5 | |
| 2/10/1989 | 11 | |
| 11/28/1988 | 10.5 | |
| 8/11/1988 | 10 | |
| 7/14/1988 | 9.5 | |
| Sell | 5/11/1988 | 9 |
| 2/2/1988 | 8.5 | |
| Buy | 11/5/1987 | 8.75 |
| 10/22/1987 | 9 | |
| 10/7/1987 | 9.25 | |
| 9/4/1987 | 8.75 | |
| 5/15/1987 | 8.25 | |
| Sell | 5/1/1987 | 8 |
| 4/1/1987 | 7.75 | |
| 8/26/1986 | 7.5 | |
| 7/11/1986 | 8 | |
| 4/21/1986 | 8.5 | |
| 3/7/1986 | 9 | |
| 6/18/1985 | 9.5 | |
| 5/20/1985 | 10 | |
| 1/15/1985 | 10.5 | |
| 12/19/1984 | 10.75 | |
| 11/28/1984 | 11.25 | |
| 11/8/1984 | 11.75 | |
| 10/24/1984 | 12 | |
| Buy | 10/16/1984 | 12.5 |
| 9/27/1984 | 12.75 | |
| 6/26/1984 | 13 | |
| 5/8/1984 | 12.5 | |
| 4/5/1984 | 12 | |
| 3/19/1984 | 11.5 | |
| Sell | 8/8/1983 | 11 |
| 2/21/1983 | 10.5 | |
| 1/11/1983 | 11 | |
| 11/22/1982 | 11.5 | |
| 10/13/1982 | 12 | |
| 10/7/1982 | 13 | |
| 9/3/1982 | 13.5 | |
| 8/18/1982 | 14 | |
| 8/16/1982 | 14.5 | |
| 8/2/1982 | 15 | |
| 7/29/1982 | 15.5 | |
| Buy | 7/20/1982 | 16 |
| 2/23/1982 | 16.5 | |
| 2/18/1982 | 17 | |
| Sell | 2/8/1982 | 16.5 |
| 12/3/1981 | 15.75 | |
| 11/24/1981 | 16 | |
| 11/16/1981 | 16.5 | |
| 11/9/1981 | 17 | |
| 11/3/1981 | 17.5 | |
| 10/13/1981 | 18 | |
| 10/5/1981 | 19 | |
| Buy | 9/15/1981 | 19.5 |
| 7/8/1981 | 20.5 | |
| 6/3/1981 | 20 | |
| 5/22/1981 | 20.5 | |
| 5/19/1981 | 20 | |
| 5/11/1981 | 19.5 | |
| 5/4/1981 | 19 | |
| 4/30/1981 | 18 | |
| Sell | 4/24/1981 | 17.5 |
| 4/2/1981 | 17 | |
| 3/17/1981 | 17.5 | |
| 3/10/1981 | 18 | |
| 2/23/1981 | 19 | |
| 2/3/1981 | 19.5 | |
| 1/9/1981 | 20 | |
| Buy | 1/2/1981 | 20.5 |
| 12/19/1980 | 21.5 | |
| 12/16/1980 | 21 | |
| 12/10/1980 | 20 | |
| 12/5/1980 | 19 | |
| 12/2/1980 | 18.5 | |
| 11/26/1980 | 17.75 | |
| 11/21/1980 | 17 | |
| 11/17/1980 | 16.25 | |
| 11/6/1980 | 15.5 | |
| 10/29/1980 | 14.5 | |
| 10/17/1980 | 14 | |
| 10/1/1980 | 13.5 | |
| 9/26/1980 | 13 | |
| 9/19/1980 | 12.5 | |
| 9/12/1980 | 12.25 | |
| 9/8/1980 | 12 | |
| 8/27/1980 | 11.5 | |
| Sell | 8/22/1980 | 11.25 |
| 7/25/1980 | 11 | |
| 7/7/1980 | 11.5 | |
| 6/17/1980 | 12 | |
| 6/13/1980 | 12.5 | |
| 6/6/1980 | 13 | |
| 5/30/1980 | 14 | |
| 5/23/1980 | 14.5 | |
| 5/16/1980 | 16.5 | |
| 5/7/1980 | 17.5 | |
| Buy | 5/1/1980 | 18.5 |
| 4/18/1980 | 19.5 | |
| 4/2/1980 | 20 | |
| 3/28/1980 | 19.5 | |
| 3/19/1980 | 19 | |
| 3/14/1980 | 18.5 | |
| 3/7/1980 | 17.75 | |
| 3/4/1980 | 17.25 | |
| 2/29/1980 | 16.75 | |
| 2/22/1980 | 16.5 | |
| 2/19/1980 | 15.75 | |
| 12/7/1979 | 15.25 | |
| 11/30/1979 | 15.5 | |
| 11/16/1979 | 14.75 | |
| 11/9/1979 | 15.5 | |
| 11/1/1979 | 15.25 | |
| 10/23/1979 | 15 | |
| 10/9/1979 | 14 | |
| 9/28/1979 | 13.5 | |
| 9/21/1979 | 13.25 | |
| 9/14/1979 | 13 | |
| 9/7/1979 | 12.75 | |
| 8/28/1979 | 12.25 | |
| 8/16/1979 | 12 | |
| 7/27/1979 | 11.75 | |
| 6/19/1979 | 11.5 | |
| 12/26/1978 | 11.75 | |
| 11/24/1978 | 11.5 | |
| 11/17/1978 | 11 | |
| 11/6/1978 | 10.75 | |
| 11/1/1978 | 10.5 | |
| 10/27/1978 | 10.25 | |
| 10/13/1978 | 10 | |
| 9/28/1978 | 9.75 | |
| 9/15/1978 | 9.5 | |
| 8/31/1978 | 9.25 | |
| 7/30/1978 | 9 | |
| 6/16/1978 | 8.75 | |
| 5/26/1978 | 8.5 | |
| 5/5/1978 | 8.25 | |
| 1/10/1978 | 8 | |
| 10/24/1977 | 7.75 | |
| 10/7/1977 | 7.5 | |
| 9/16/1977 | 7.25 | |
| 8/22/1977 | 7 | |
| Sell | 5/31/1977 | 6.75 |
| 5/13/1977 | 6.5 | |
| 11/24/1976 | 6.25 | |
| 11/1/1976 | 6.5 | |
| 9/24/1976 | 6.75 | |
| Buy | 8/3/1976 | 7 |
| Sell | 6/10/1976 | 7.25 |
| 6/1/1976 | 7 | |
| 1/21/1976 | 6.75 | |
| 1/12/1976 | 7 | |
| 12/2/1975 | 7.25 | |
| 11/7/1975 | 7.5 | |
| Buy | 10/28/1975 | 7.75 |
| 9/12/1975 | 8 | |
| 8/11/1975 | 7.75 | |
| Sell | 7/29/1975 | 7.5 |
| 7/20/1975 | 7.25 | |
| 6/9/1975 | 7 | |
| 5/20/1975 | 7.25 | |
| 3/24/1975 | 7.5 | |
| 3/18/1975 | 7.75 | |
| 3/10/1975 | 8 | |
| 3/5/1975 | 8.25 | |
| 2/24/1975 | 8.5 | |
| 2/18/1975 | 8.75 | |
| 2/10/1975 | 9 | |
| 2/3/1975 | 9.25 | |
| 1/28/1975 | 9.5 | |
| 1/20/1975 | 9.75 | |
| 1/15/1975 | 10 | |
| 1/9/1975 | 10.25 | |
| 11/25/1974 | 10.25 | |
| 11/13/1974 | 10.75 | |
| 11/6/1974 | 11 | |
| Buy | 10/22/1974 | 11.25 |
| 10/8/1974 | 11.75 | |
| 7/8/1974 | 12 | |
| 6/27/1974 | 11.75 | |
| 5/17/1974 | 11.5 | |
| 5/10/1974 | 11.25 | |
| 5/7/1974 | 11 | |
| 5/2/1974 | 10.75 | |
| 4/25/1974 | 10.5 | |
| 4/22/1974 | 10.25 | |
| 4/11/1974 | 10 | |
| 4/8/1974 | 9.75 | |
| 4/4/1974 | 9.5 | |
| 4/1/1974 | 9.25 | |
| Sell | 3/22/1974 | 9 |
| 2/25/1974 | 8.75 | |
| 2/19/1974 | 9 | |
| Buy | 2/11/1974 | 9.25 |
| 1/29/1974 | 9.5 | |
| Sell | 12/3/1973 | 9.75 |
| Buy | 10/29/1973 | 9.5 |
| 10/23/1973 | 9.75 | |
| 9/18/1973 | 10 | |
| 8/28/1973 | 9.75 | |
| 8/21/1973 | 9.5 | |
| 8/13/1973 | 9.25 | |
| 8/6/1973 | 9 | |
| 7/30/1973 | 8.75 | |
| 7/18/1973 | 8.5 | |
| 7/9/1973 | 8.25 | |
| 7/2/1973 | 8 | |
| 6/22/1973 | 7.75 | |
| 6/7/1973 | 7.5 | |
| 5/25/1973 | 7.25 | |
| 5/7/1973 | 7 | |
| 4/19/1973 | 6.75 | |
| 3/26/1973 | 6.5 | |
| 2/27/1973 | 6.25 | |
| 12/27/1972 | 6 | |
| 10/3/1972 | 5.75 | |
| 8/29/1972 | 5.5 | |
| 6/27/1972 | 5.25 | |
| Sell | 3/31/1972 | 5 |
| 3/20/1972 | 4.75 | |
| 2/16/1972 | 4.5 | |
| 1/18/1972 | 4.75 | |
| 1/3/1972 | 5 | |
| 12/17/1971 | 5.25 | |
| 11/8/1971 | 5.5 | |
| Buy | 10/20/1971 | 5.75 |
| Sell | 7/7/1971 | 6 |
| 4/23/1971 | 5.5 | |
| 3/19/1971 | 5.25 | |
| 3/11/1971 | 5.5 | |
| 2/16/1971 | 5.75 | |
| 1/18/1971 | 6 | |
| 1/15/1971 | 6.25 | |
| 1/6/1971 | 6.5 | |
| 12/22/1970 | 6.75 | |
| 11/23/1970 | 7 | |
| 11/12/1970 | 7.25 | |
| Buy | 9/21/1970 | 7.5 |
| 3/25/1970 | 8 | |
| 6/9/1969 | 8.5 | |
| 3/17/1969 | 7.5 | |
| 1/7/1969 | 7 | |
| Sell | 12/18/1968 | 6.75 |
| 12/2/1968 | 6.5 | |
| Buy | 9/25/1968 | 6.25 |
| Sell | 4/19/1968 | 6.5 |
| 11/20/1967 | 6 | |
| 3/27/1967 | 5.5 | |
| Buy | 1/26/1967 | 5.75 |
| 8/16/1966 | 6 | |
| 6/29/1966 | 5.75 | |
| Sell | 3/10/1966 | 5.5 |
| 12/6/1965 | 5 | |
| Buy | 8/23/1960 | 4.5 |
| 9/1/1959 | 5 | |
| Sell | 5/18/1959 | 4.5 |
| 9/11/1958 | 4 | |
| 4/21/1958 | 3.5 | |
| Buy | 1/22/1958 | 4 |
| 8/6/1957 | 4.5 | |
| 8/21/1956 | 4 | |
| 4/13/1956 | 3.75 | |
| Sell | 10/14/1955 | 3.5 |
| 8/4/1955 | 3.25 | |
| Buy | 3/17/1954 | 3 |
| 4/27/1953 | 3.25 | |
| 12/19/1951 | 3 | |
| 10/17/1951 | 2.75 | |
| 1/8/1951 | 2.5 | |
| Sell | 9/22/1950 | 2.25 |
| 8/1/1948 | 2 | |
| 12/1/1947 | 1.75 |
The Prime Rate Indicator may have passed its prime
“The trend in interest rates and Federal Reserve policy is the dominant factor in determining the stock market’s major direction” according to Martin Zweig in Winning on Wall Street. In telling his readers how to get in and out of the stock market at optimal moments, Zweig began with the Prime Rate Indicator.
The Prime Rate is the rate at which banks lend money to their most-favored customers. Zweig observed that changes in the Prime Rate coincided with changes in the trend of the stock market. He created the Prime Rate Indicator by defining buy and sell rules based upon the direction and size of changes in the Prime Rate. An investment of $10,000 based upon the Prime Rate Indicator in the 42 year period from 1954 through 1996 would have increased by a compound annual growth rate of 11.58 percent to $996,909.00.
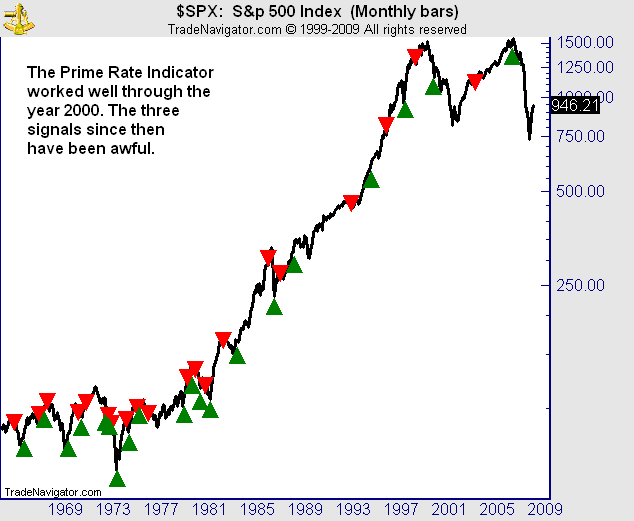
Prime Rate Indicator Buy and Sell Signals
The performance of the Prime Rate Indicator since 2001 has not matched the performance of previous years. The last three signals have been spectacularly bad. The approach produced a buy signal on February 1, 2001 and then the S&P 500 fell 42 percent. The approach produced a sell signal on August 11, 2004 and then stocks rallied 41 percent. The most recent signal from the Prime Rate Indicator was a buy signal on September 18, 2007. The S&P 500 achieved an all-time high three weeks later and then fell by 50 percent.
Maybe the financial arena has changed in fundamental ways and the Prime Rate Indicator no longer works. Or maybe the Prime Rate Indicator has never “worked.”
The Prime Rate Indicator assumes that interest rates are important to the trend of the stock market, but maybe that’s not how things work. Maybe the trend of the stock market determines the direction and size of interest rate changes.
The chart of the S&P 500 with Prime Rate Indicator Buy and Sell Signals shows that after the stock market has been rising for a while, interest rates typically rise and produce a sell signal. And after the stock market has been falling for a while interest rates typically fall and produce a buy signal. Conventional wisdom says that it is the rise of interest rates that stops the stock market from rising, but maybe it is the rise of the stock market that forces interest rates up and the fall of the stock market that forces interest rates down.
The last three signals of the “Prime Rate Indicator” actually make sense if stock market moves are the dominant factor in determining the major direction of interest rates. The buy signal of February 2001 developed after the stock market had fallen sharply. In this case, the fall wasn’t finished yet and the buy signal preceded stocks bottoming by 20 months. Similarly, the sell signal of August 2004 developed after the stock market had risen sharply, but the advance still had a long way to go. The last buy signal developed after the Value Line Composite Index and a variety of global stock indexes had fallen for two months.
Regardless of which comes first, the stock market move or the interest rate change, the Prime Rate Indicator has not marked stock market turns accurately for a long time and should probably not be used as a primary timing approach. The Buy and Sell Signals from the Prime Rate Indicator may best be used to strengthen or weaken confidence in investment decisions based upon other approaches to stock market timing.
Click here to see documentation of Prime Rate Indicator Buy and Sell Signals since 1947.
Know when to hold and when to fold with the Four Percent Indicator
The Four Percent Indicator guides you to being invested in all major market moves and has produced big gains over the past 25 years. An investment of $100,000 based upon the Four Percent Indicator would have increased to $1,574,162.05 over the past 25 years, a gain of 1474 percent.
The approach is simple and effective, but requires discipline to achieve success because short-term swings that exceed four percent produce losing periods. In addition, as is common with many effective market timing systems, the approach produces more losing than winning signals. Only 42 percent of the 115 signals over the last 25 years have produced gains. However, the winning signals have consistently exceeded the losses of the losing signals and generated big profits over time.
You can examine the performance of the last 115 completed signals of the Four Percent Indicator in the Value Line Arithmetic Index from the buy signal of August 3, 1984 through the latest buy signal of May 29, 2009 by clicking here.
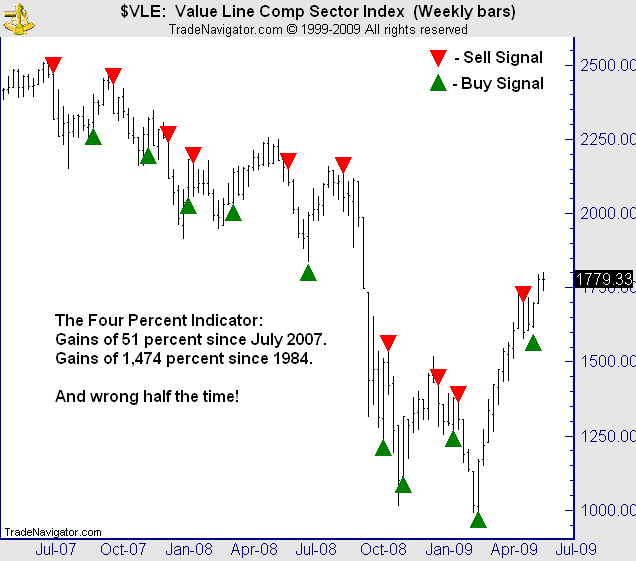
Four Percent Indicator Buy and Sell Signals
The approach gives a buy signal when the weekly close of the stock market is four percent above low points (local minima) and a sell signal when the weekly close is four percent below high points (local maxima). For example, the Value Line Index closed at a low point of 1016 on March 6, 2009. The index closed more than 4 percent higher the next week on March 13th, producing a buy signal. That buy signal remained in effect until the index closed down more than 4 percent on May 15th from the closing high of May 8th. The sell signal from that decline was reversed when the market closed up on May 29th more than 4 percent above the May 15th closing low.
Ned Davis developed the Four Percent Indicator based upon the Value Line Composite Index. Martin Zweig popularized its use in his 1986 book Winning on Wall Street.
Very few investors make more money in the stock market than anyone using the Four Percent Indicator could make. Very likely, you would be richer today if you had followed this approach from the first year that you began investing.
You can’t change the past, but you can change your investing future. The Four Percent Indicator is a simple tool that you can use to build a financially sound future. Look at the numbers and see for yourself.
 Financial markets are predictable because segments of price action fit together in a limited number of patterns that are not random. Markets are unpredictable too because there is enough variability in the patterns to hide the trend at some stages of development. I am fascinated by the market and spend a lot of time working to identify price trends so I can exploit them for profit.