Important signals turned bullish today
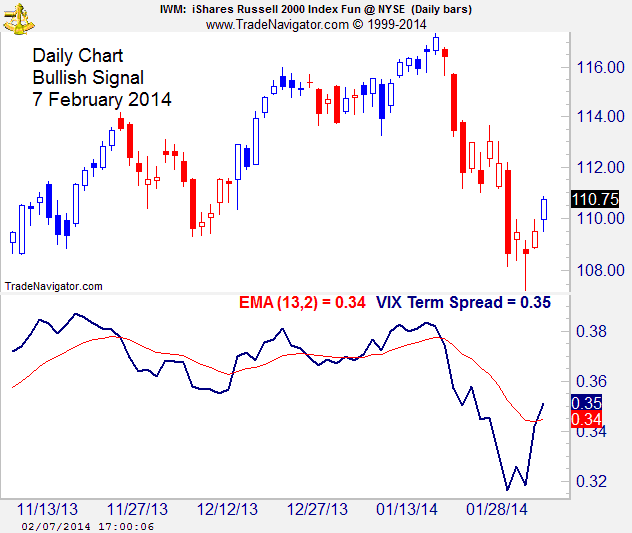
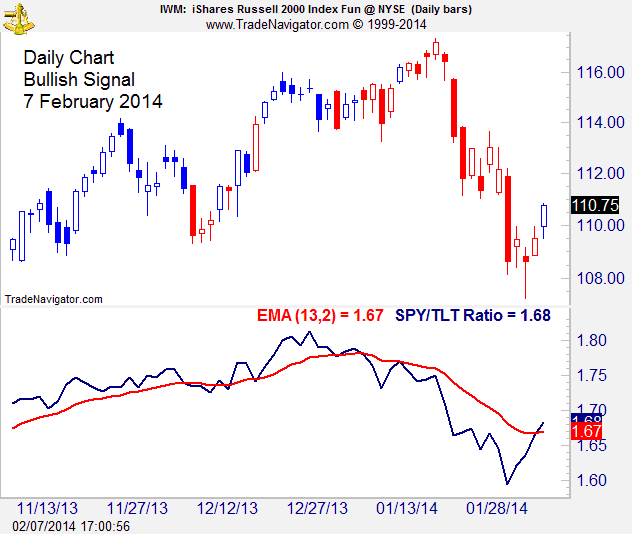
Some daily signals remain bearish, but two important ones turned bullish today. The volatility spread and the SPY/TLT spread. You might go long SPY and short TLT at this juncture or the shares and bonds of your choice.
Signals are setting up to change course
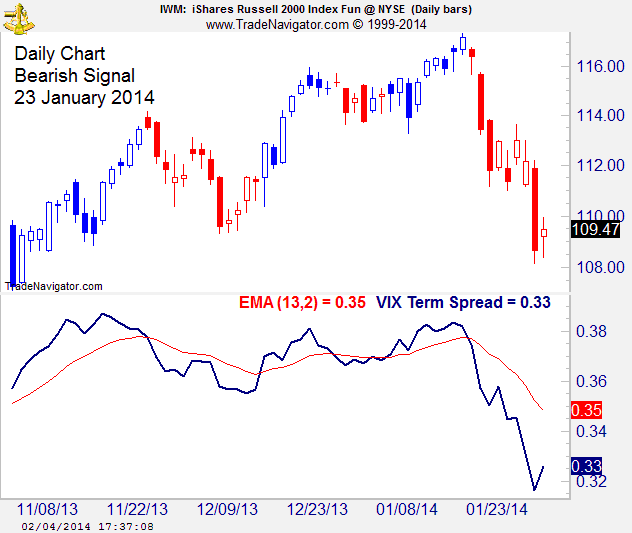
The volatility spread is turning up. Crossing its moving average would trigger a bullish signal.
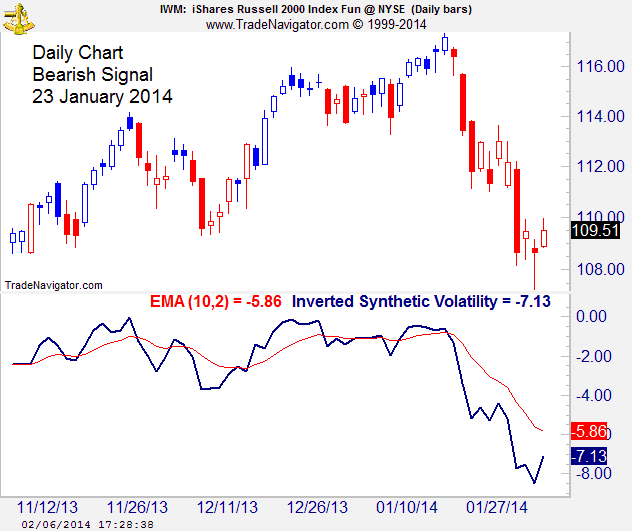
The synthetic volatility spread that is calculated for this particular chart is turning up too, although it appears farther from a bullish signal.
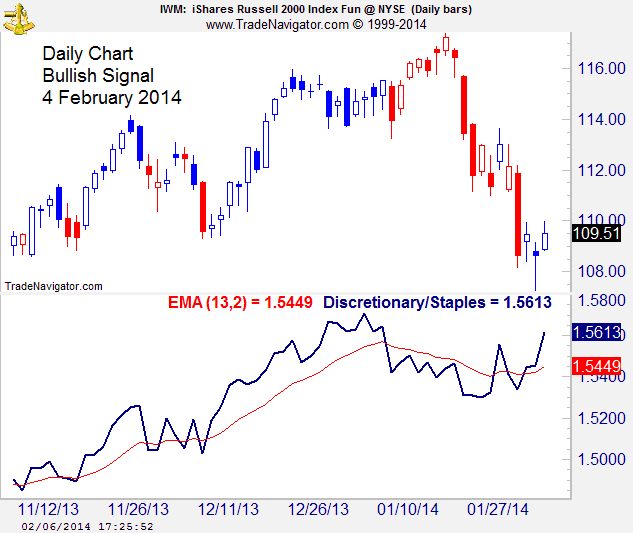
The discretionary/staples spread turned bullish on 4 February. I am not quite ready to adopt a fully bullish outlook, but I did establish some deep in-the-money call spreads in honor of market strength today.
The Small Cap/Large Cap Ratio remains bearish
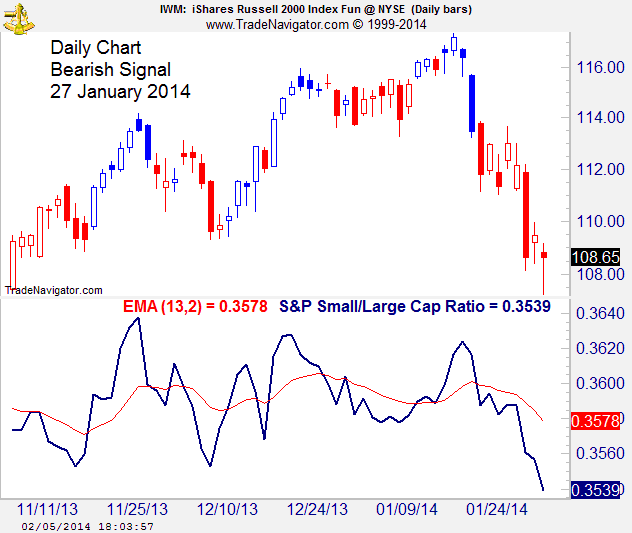
The signal based upon the small cap/large cap ratio – S&P 600/S&P 500 – did not turn fully bearish until 27 January on the daily chart, but remains unflinchingly bearish today.
The trend remains bearish despite today’s respite
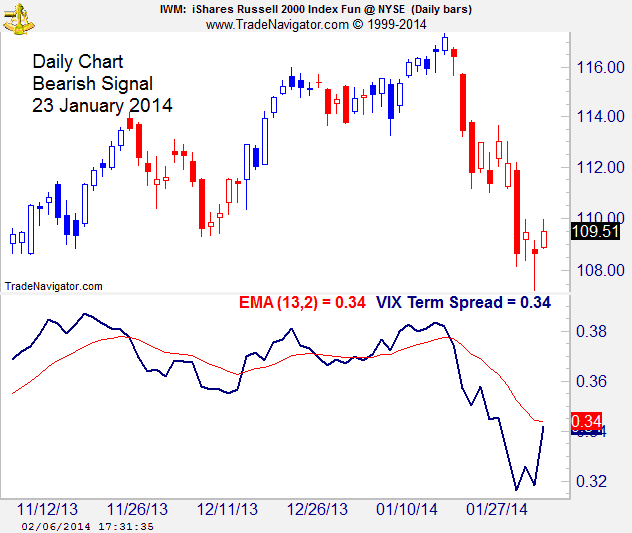
The volatility spread is off its lows, but remains well under its moving average, which is bearish.
The trend remains seriously bearish
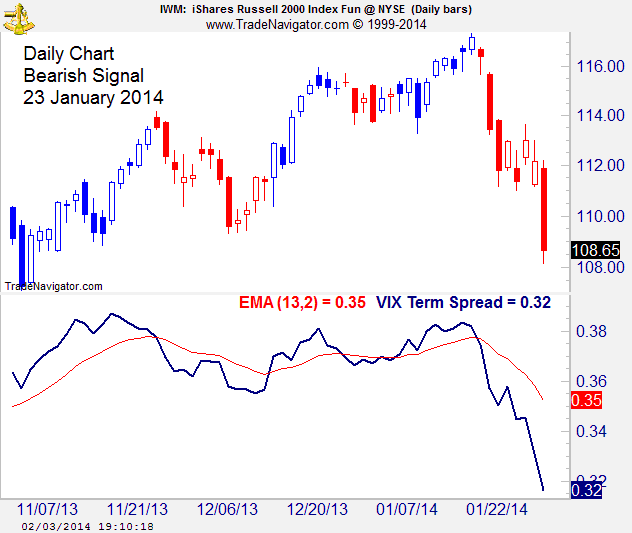
The message from volatility is that the trend is seriously down.
Weekly charts feature bearish signals too
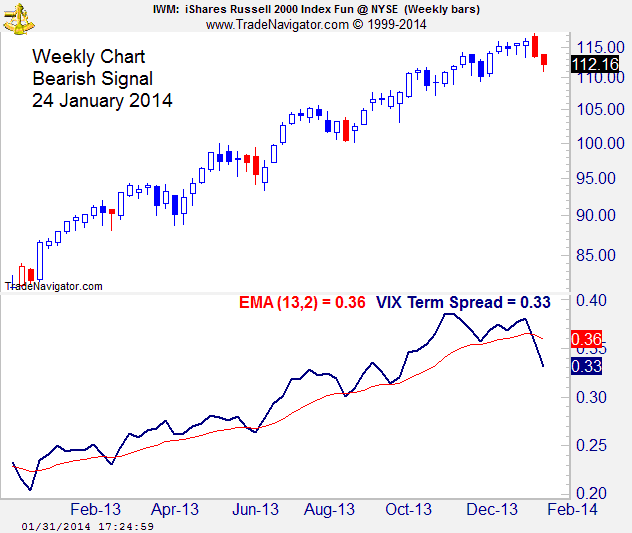
The volatility spread is solidly bearish on the weekly chart as well as the daily. The study is currently the farthest under its moving average it has been since August 2011, which invites keeping our focus on the downside.
 Financial markets are predictable because segments of price action fit together in a limited number of patterns that are not random. Markets are unpredictable too because there is enough variability in the patterns to hide the trend at some stages of development. I am fascinated by the market and spend a lot of time working to identify price trends so I can exploit them for profit.